Eleventy Site Statistics

Posted: May 10, 2023 | Categories: Eleventy
As I worked to migrate this site to Eleventy, one of the final touches I wanted to add was a statistics page that showed 'stuff' about the site. The page started simple at first, but then I started thinking about what I could do with 14 years of post data.
I knew I could add a collection to my site and use that to build a data set showing the number of posts per year as well as the average number of days between posts. At that point, I realized I could make an Eleventy plugin out of it so others could use it as well and this would give me an opportunity to learn how to make Eleventy plugins.
I published the plugin yesterday as Eleventy-Plugin-Post-Stats and added the complete Stats page to the site.
You can find the implementation of a page that uses all of the properties of the stats object in this repository's index.liquid file. Here's the source code for the page:
---
title: Site Statistics
description: A list of statistics about this site.
layout: generic
---

{% if collections.postStats.count > 0 %}
  <ul>
    <li>
      <strong>Post Count:</strong>
      {{ collections.postStats.count | commaize }}</li>
    <li>
      <strong>Average days between posts:</strong>
      {{ collections.postStats.avgDays | commaize }}</li>
    <li>
      <strong>First Post:</strong>
      {{ collections.postStats.firstPostDate | readableDate }}
    </li>
    <li>
      <strong>Last Post:</strong>
      {{ collections.postStats.lastPostDate | readableDate }}
    </li>
    <li>
      <strong>Deployments:</strong>
      {{ buildinfo.buildCounter | commaize }}
    </li>
    <li>
      <strong>Build Date:</strong>
      {{ buildinfo.buildDateStr }}
    </li>
    <li>
      <strong>Build Version:</strong>
      {{ buildinfo.buildVersion }}
    </li>
    <li>
      <strong>Generator:</strong>
      <a href="https://www.11ty.dev/" target="_blank">{{ eleventyinfo.generatorStr }}</a>
    </li>
  </ul>

  <style>
    table,
    th,
    td {
      width: 350px;
      text-align: center;
      vertical-align: bottom;
    }

    .chart-container {
      max-width: 1280px;
    }
  </style>

  <table>
    <thead>
      <tr>
        <th>Year</th>
        <th>Count</th>
        <th>Avg. Days Between Posts</th>
      </tr>
    </thead>
    <tbody>
      {% for year in collections.postStats.years %}
        <tr>
          <td>{{ year.year }}</td>
          <td>{{ year.count }}</td>
          <td>{{ year.avgDays }}</td>
        </tr>
      {% endfor %}
    </tbody>
  </table>

  <div class="chart-container">
    <canvas id="statsChart"></canvas>
  </div>

  <script src="https://cdn.jsdelivr.net/npm/chart.js"></script>
  <script>
    const ctx = document.getElementById('statsChart');
    new Chart(ctx, {
      data: {
        labels: [{% for year in collections.postStats.years %}'{{ year.year }}'{%- unless forloop.last %},{% endunless %}{% endfor %}],
      datasets: [
        {
          type: 'bar',
          label: 'Number of Posts',
          data: [{% for year in collections.postStats.years %}{{ year.count | commaize }}{%- unless forloop.last %},{% endunless %}{% endfor %}],
          borderWidth: 1,
          order: 1
        }, {
          type: 'line',
          label: 'Average Number of Days Between Posts',
          data: [{% for year in collections.postStats.years %}{{ year.avgDays | commaize }}{%- unless forloop.last %},{% endunless %}{% endfor %}],
          lineTension: 0.8,
          order: 2
        }
      ]
    },
    options: {
      scales: {
        y: {
          beginAtZero: true,
          title: {
            display: true,
            text: 'Number of Posts'
          }
        },
        x: {
          title: {
            display: true,
            text: 'Post Year'
          }
        }
      }
    }
  });
  </script>

{% else %}
  <p>
    <strong>No data to display</strong>
  </p>

{% endif %}
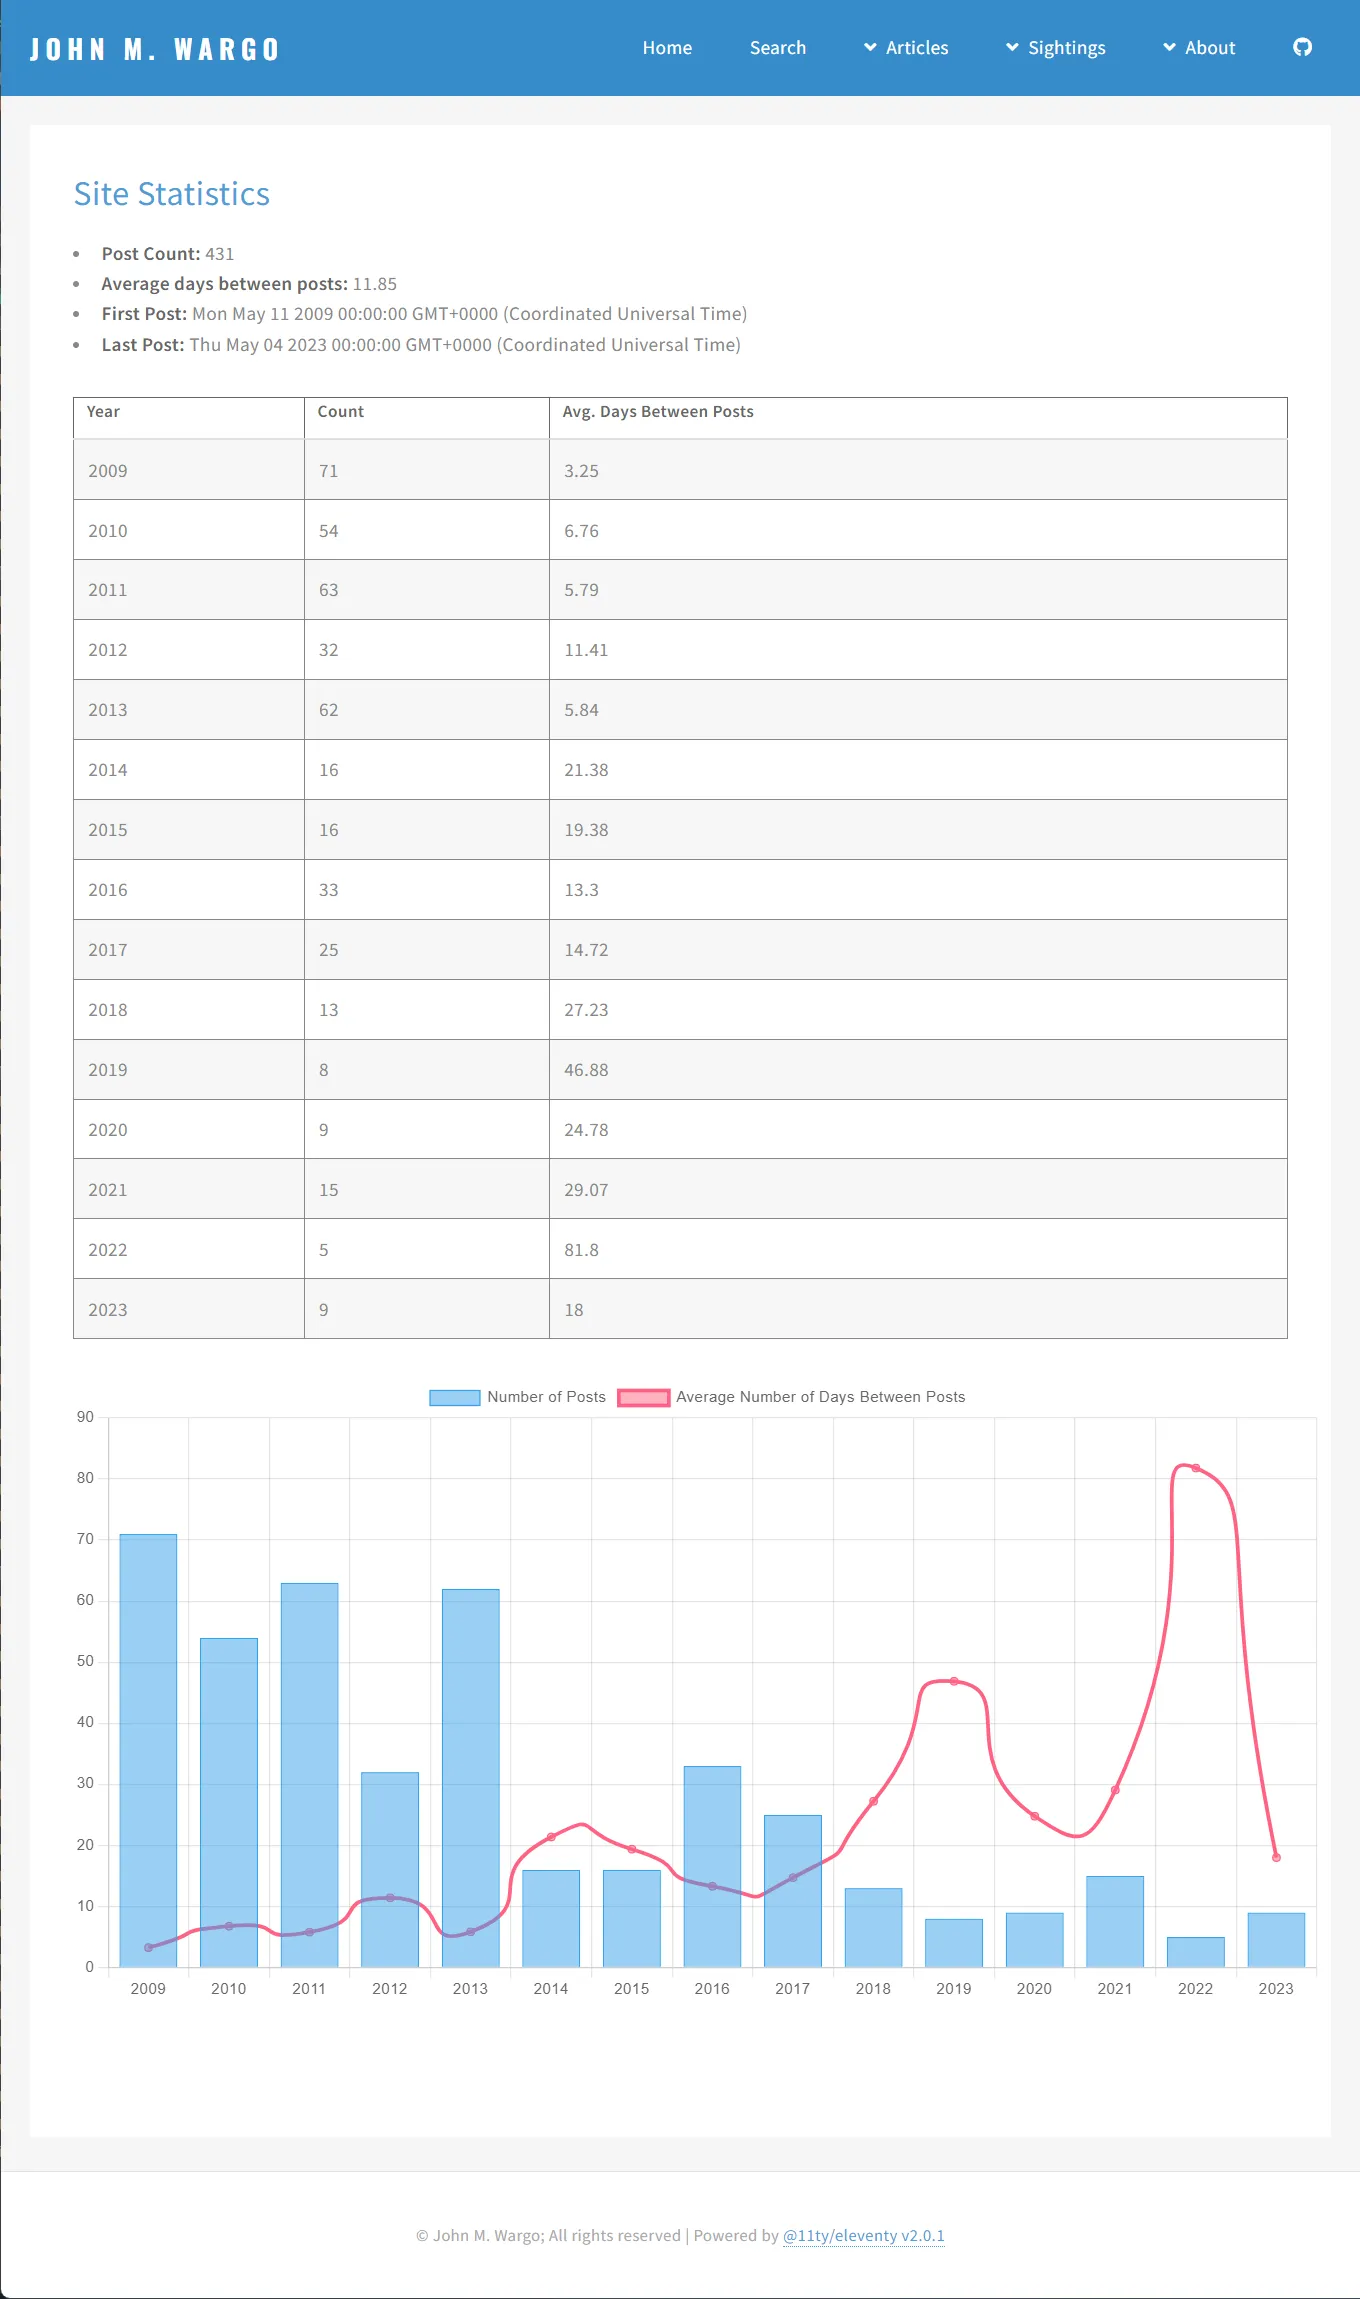
I'm in the process of tightening up the table, but here's what the page looks like today:

Next Post: Automating Eleventy Post Creation
Previous Post: Gadget Man
If this content helps you in some way, please consider buying me a coffee.
Header image: Eleventy Project Home Page.